ABSTRACT: Pulmonary embolism (PE) is a major cause of morbidity and mortality, necessitating accurate risk stratification for effective management. The European Society of Cardiology (ESC) guidelines provide an established framework for diagnosing and treating PE, including the use of the Pulmonary Embolism Severity Index (PESI) and the risk stratification to predict 30-day mortality risk. In this study, we analyzed 368 patients with a primary diagnosis of PE from the MIMIC-III database. Using logistic regression models, we assessed the impact of demographic variables, clinical characteristics, and comorbidities on 30-day mortality. Findings indicate that cancer, hemodynamic instability, heart rate, and systolic blood pressure significantly impact 30-day mortality rates. Patients classified as PESI Class IV or V had a markedly higher mortality risk compared to those in lower classes. Additionally, high-risk stratification based on ESC guidelines showed a strong correlation with adverse outcomes. The model demonstrated strong predictive capability, with a receiver operating characteristic (ROC) curve analysis yielding an area under the curve (AUC) of 0.8537. These results emphasize the importance of comprehensive risk assessment in managing PE patients and highlight the need for continuous monitoring and aggressive intervention in high-risk cases.
Introduction
Pulmonary embolism (PE) is a life-threatening condition caused by the obstruction of pulmonary arteries, and represents a major cause of morbidity and mortality, with risk stratification playing a crucial role in clinical decision-making. The European Society of Cardiology (ESC) guidelines provide a structured approach to the diagnosis and management of PE, emphasizing the importance of early risk assessment to guide treatment strategies. Risk stratification of patients with acute PE is mandatory for determining the appropriate therapeutic management approach. Initial risk stratification is based on clinical symptoms and signs of hemodynamic instability, which indicate a high risk of early death. In the large remaining group of patients, further risk stratification is required, and parameters such as Cardiac troponin I or T elevation in concentrations above the normal limits on admission may be associated with a worse prognosis in the acute phase of PE. 1 Baseline parameters related to aggravating conditions and comorbidity are necessary to assess a patient’s overall mortality risk and early outcome. Of the clinical scores integrating PE severity and comorbidity, the Pulmonary Embolism Severity Index (PESI) is the one that has been most extensively validated to date. Regardless of the score used, the proportion of patients with confirmed PE can be expected to be ~ 10% in the low-probability category, 30% in the moderate-probability category, and 65% in the high probability category. 2
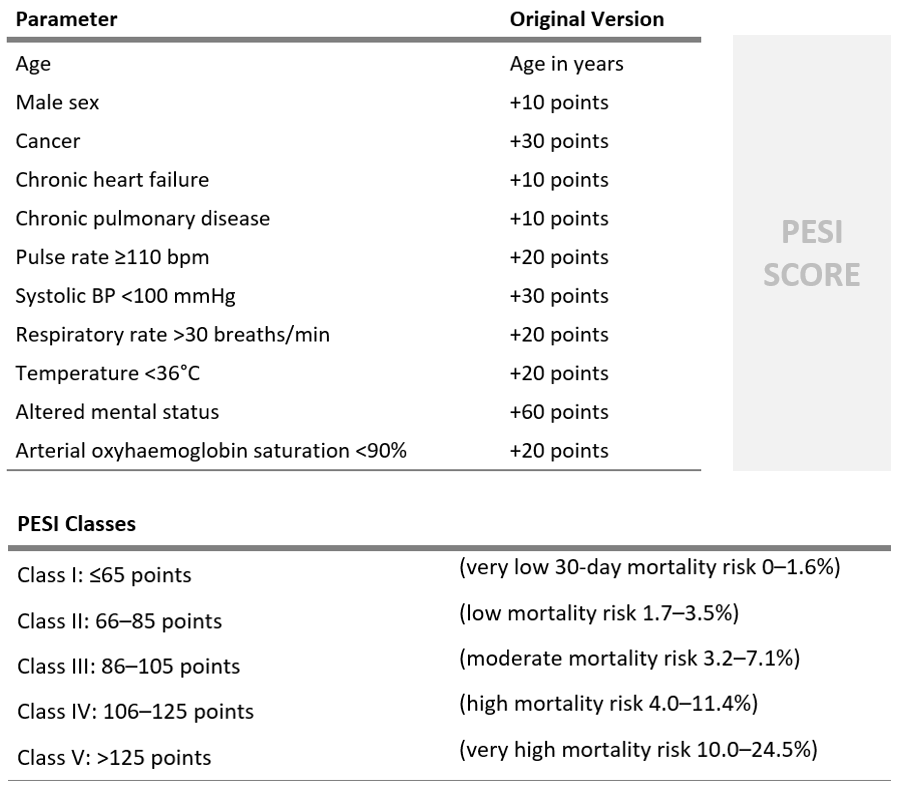
Image1 - PESI score variables and classification
Methodology
Mimic III database was used to obtain data for the cohort. All the admissions where the primary diagnosis (SEQ_NUM =1) was Pulmonary Embolism (ICD9 starting in 4151), were selected, and since there we more than one admission for different patients, the latest admission was selected those, obtaining 368 patients.

Image 2 - MIMIC III cohort and variables analyzed
From the admissions table, considering the selected admission for each patient, the time of the admission, discharge location, and diagnosis where extracted. From the patients table, gender, date of birth, date of death, and dead status where extracted. Age was computed considering the admission time and the date of birth for each patient. As dates are shifted to preserve de-identification, patients with age > 89 (which in reality would be > 100), were assigned age of 100. To analyze if the patients suffered or had suffer cancer, diagnoses table was analyzed, based on the diagnosis ICD9 codes (140 – 176 | 179 – 200 | 2091,2092,2093), correlating this with the subject and admission. From the admission table, admission times were extracted, and only events that were prior to the primary pulmonary embolism diagnosis admission were considered. Cancer was set as factor (0|1) with a n=89. The same analysis was performed for chronic heart failure events, considering the ICD9 codes (414 | 428) that included ‘Chron’ in their long title descriptor from the diagnostics dictionary. Heart failure was set as factor (0|1) with a n=26. For chronic pulmonary disease, the ICD9 codes (490 - 496) that included ‘Chron’ in their long title descriptor from the diagnostics dictionary were considered, excluding 490 as it was not specified if it was acute or chronic. This time again only events prior to the pulmonary embolism diagnostic were considered. Chronic pulmonary disease was set as factor (0|1) with a n=53. To obtain the measure related to the chartevents table, the selected primary pulmonary embolism admission was considered for each patient, and the information extracted was relative to that admission. To obtain the heart rate, ITEMID (211 | 22045) where analyzed, and the average from all the measures for the selected admission per patient were used. As the range was clinically relevant (min:48,59, max:131,66), no outliers were identified and all data was considered. N=368 – 6 (na) To obtain the systolic blood pressure, labels of the Item dictionary were analyzed, including those that contained ‘systolic’, and excluding ‘otrhos’ ( as it refers to the orthostatic blood pressure not relevant in this case), and the average from all the measures for the selected admission per patient were used. As the range was clinically relevant (min:62,8, max:175,92), no outliers were identified and all data was considered. N=362, na= 6. To obtain the respiratory rate, labels of the Item dictionary including ‘respir.rate’ were considered, and the average from all the measures for the selected admission per patient were used. As the range was clinically relevant (min:11.17, max:36,8), no outliers were identified and all data was considered. N=362, na= 6. For the temperature measurement, Item codes (645|676|3655|224027|224642|223762) were used, depicting different temperature measurements. In this case, there were not many measurements, and only 15 admissions had a registry. N=15, na=353. Regarding SPO2 values, item labels were analyzed and included all which contained (oxygen.sat | Spo2 ). 172 patients didn’t have this measure. N=196, na=172 The troponin I and troponin T levels were analyzed from the laboratory result database, and the items regarding these two measures were (51002|51003). As in the other cases, all the measures for each pulmonary embolism primary diagnosis admission were averaged. N=204, na=164 For the altered mental status, a search on the discharge summary was performed, and those which included the term ‘altered mental status’ were identified. This was considered as a factor (0|1). N= 40 , na=328. Hemodynamic instability was defined as the guidelines, and this information was obtained from the discharge summary notes including the events (cardiac arrest|obstructive shock| persistent hypotension). This was considered as a factor (0|1). N= 30 , na=338. Lastly, computing the date of death from the patients database, and comparing it with the admission date for the primary diagnosis for pulmonary embolism admission, the factor for mortality after 30 days was computed. N=51 PESI scores were computed for each patient, based on the average values for the selected admission measurements, and the class was assigned as a five-level factor based on the results. Lastly 30-day mortality risk was computed based on the measures and logic described as a three-level factor. Risk stratification was performed taking into account the guidelines 1. High risk was determined as hemodynamic instability independent of the PESI classification. Intermediate risk was determined as PESI classification III – V, and troponin levels > 0,014 ng/ml. Low risk represents the rest of the cases.
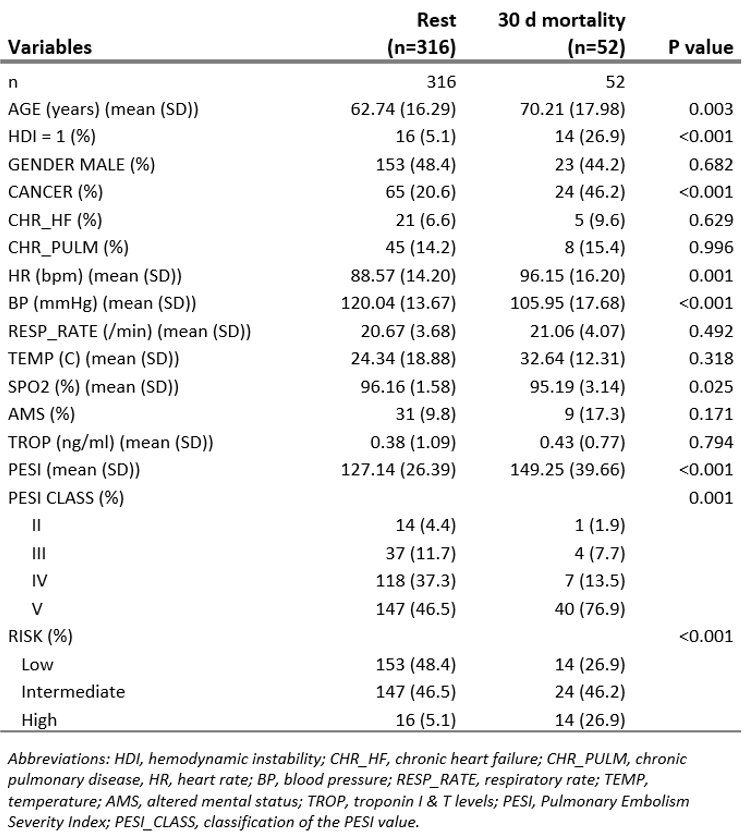
Image 3 - Variables and patient characteristics for patients with pulmonary embolism as primary diagnostic divided by the those that 30 days after admission were deceased
Results
The logistic regression analysis identified several significant predictors of 30-day mortality. Patients with cancer exhibited an odds ratio (OR) of 3.76 (95% CI: 1.75–8.29, p = 0.0008), indicating a nearly fourfold increase in mortality risk. Hemodynamic instability was another strong predictor, with affected patients experiencing a significantly higher mortality rate (26.9% vs. 5.1%, p < 0.001), which is directly ligated to high-risk stratification. PESI classification was strongly associated with mortality outcomes. Patients classified as PESI Class V accounted for 76.9% of 30-day mortality cases. Additionally, high-risk categorization per ESC guidelines showed a significant correlation with adverse outcomes (OR: 6.61, 95% CI: 2.15–20.86, p = 0.001). Vital sign abnormalities also correlated with mortality risk. Higher heart rates were associated with increased risk, with non-survivors exhibiting a mean heart rate of 96.15 bpm compared to 88.57 bpm in survivors (p = 0.001). Similarly, lower systolic blood pressure was a key determinant, with an average of 105.95 mmHg in non-survivors versus 120.04 mmHg in survivors (p < 0.001). These values correlate with the thresholds dictated by the ESC guidelines. Further analysis revealed that oxygen saturation (SpO2) levels were significantly lower in non-survivors (95.19% vs. 96.16%, p = 0.025). Troponin levels, while elevated in some patients, did not reach statistical significance in predicting mortality (p = 0.794). Due to these results, the variables were not included in the model directly, but are present in the risk stratification and PESI score. The presence of altered mental status was more frequent in non-survivors (17.3% vs. 9.8%), although this association was not statistically significant (p = 0.171).
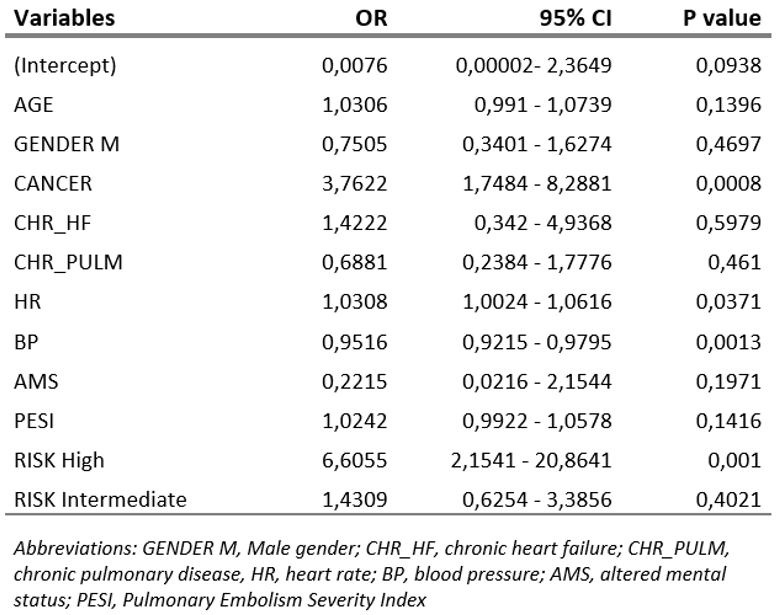
Image 4 - Logistic regression analysis of the PESI classification and risk factor to 30 day mortality
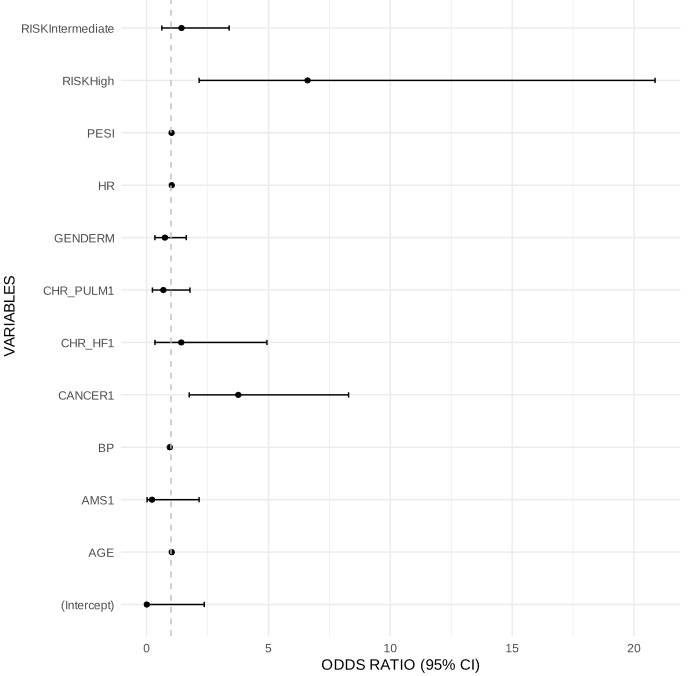
Image 5 - Odds ratios and 95% CI for the variables analyzed
Receiver operating characteristic (ROC) curve analysis confirmed the strong predictive capability of the logistic regression model, with an area under the curve (AUC) of 0.8537, suggesting excellent discrimination between survivors and non-survivors. These findings reinforce the reliability of PESI and ESC guidelines in assessing 30-day mortality risk in PE patients.
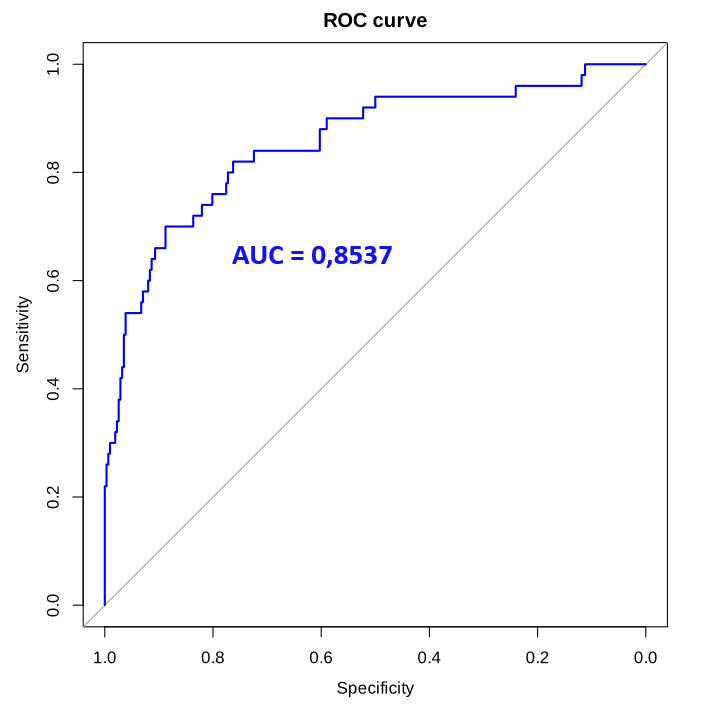
Image 6 - Accuracy for predicting 30 day mortality by receiver operator characteristics (ROC) analysis. AUC= 0.8537
Discussion
This study highlights the critical importance of early risk stratification in patients with PE. Our findings reaffirm previous research indicating that PESI classification and ESC risk stratification are highly effective in predicting short-term mortality risk. The strong association between cancer and mortality aligns with prior studies. The predictive model demonstrated strong accuracy, with an AUC of 0.8537, indicating excellent discriminative power. This suggests that integrating vital sign parameters, PESI classification, and comorbidities into a comprehensive risk assessment model can enhance early identification of high-risk patients and improve clinical outcomes. Despite these strengths, the study has limitations. Vital signs data was mostly available but factor such as temperature, troponin levels or specific imaging characteristics could be extended and are dependable on the admission.
Bibliography
- Konstantinides, S. V. et al. 2019 ESC Guidelines for the diagnosis and management of acute pulmonary embolism developed in collaboration with the European Respiratory Society (ERS). Eur. Heart J. 41, 543–603 (2020).
- Ceriani, E. et al. Clinical prediction rules for pulmonary embolism: a systematic review and meta-analysis. J. Thromb. Haemost. 8, 957–970 (2010).